Project Overview
Employee turnover represents one of the most significant challenges facing organizations, with far-reaching implications for productivity, morale, and bottom-line performance. This case study examines the employee retention challenges at Salifort Motors, where rising departure rates have prompted leadership to conduct a comprehensive analysis of the underlying factors driving talent attrition.
Business Problem
Understanding why valued team members choose to leave is crucial not only for reducing costly turnover and recruitment expenses, but also for creating a more engaging, supportive work environment that attracts and retains top talent in an increasingly competitive automotive industry landscape. This is a binary classification problem where we need to predict whether an employee will leave (1) or stay (0).
Project Goals
- Analyze employee data to understand patterns and relationships
- Build predictive models to identify employees at risk of leaving
- Identify key factors that contribute to employee turnover
- Provide actionable, data-driven recommendations to improve employee retention
- Help HR develop targeted retention strategies
Dataset Overview
The dataset contains 14,999 employee records (after removing duplicates from the original 15,000) with a mix of numerical and categorical features. Key variables include satisfaction level, evaluation scores, project count, and working hours - all potential indicators of employee satisfaction and workload.
Data Features
- satisfaction_level: Employee-reported job satisfaction level [0–1]
- last_evaluation: Score of employee's last performance review [0–1]
- number_project: Number of projects employee contributes to
- average_monthly_hours: Average number of hours employee worked per month
- time_spend_company: How long the employee has been with the company (years)
- work_accident: Whether or not the employee experienced an accident while at work
- left: Whether or not the employee left the company (target variable)
- promotion_last_5_years: Whether or not the employee was promoted in the last 5 years
- department: The employee's department (10 unique departments)
- salary: The employee's salary level (low, medium, high)
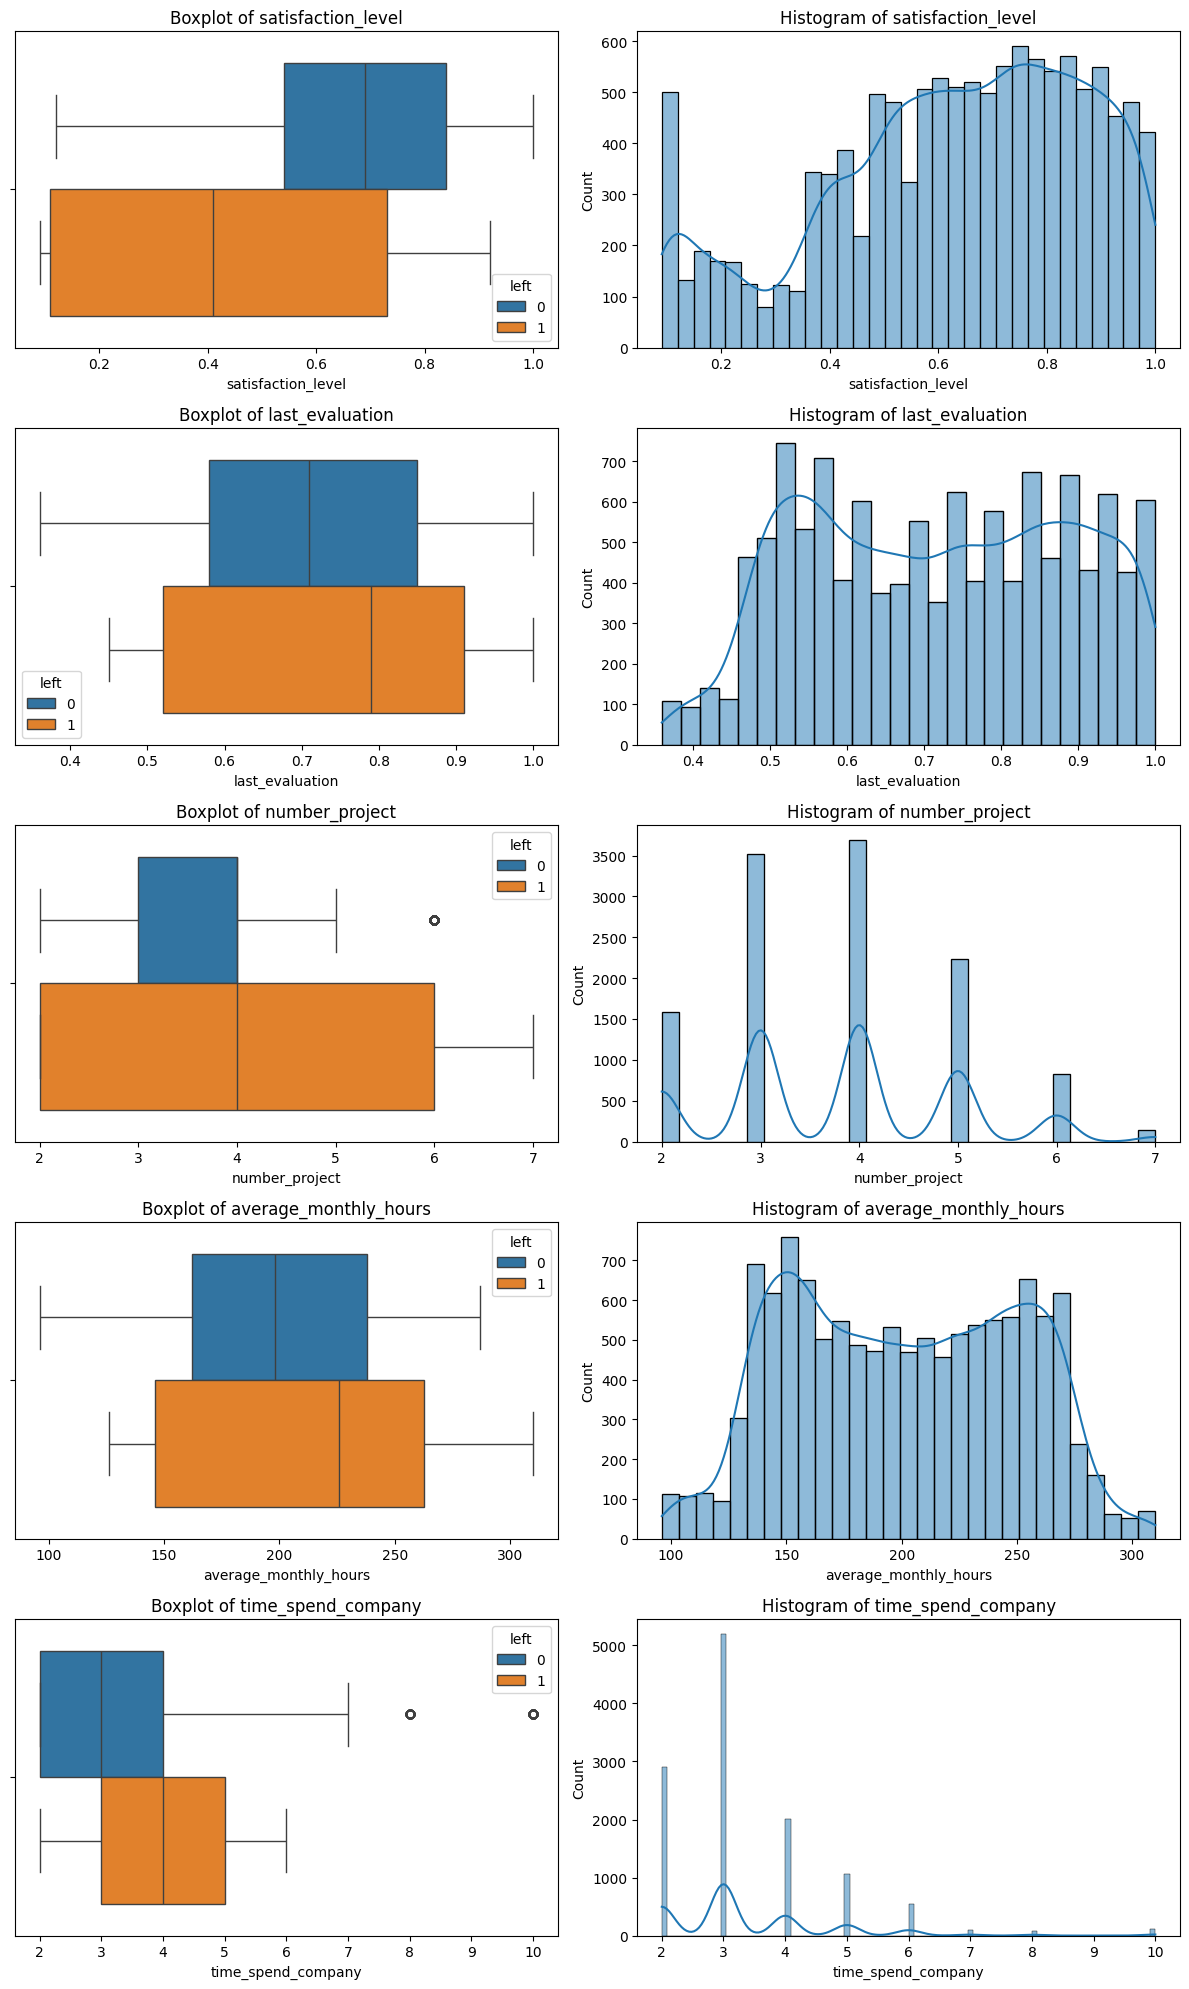
Figure 1: Distribution of key numerical features (Satisfaction, Evaluation, Projects, Hours, Tenure) segmented by employee status (Stayed vs. Left).
Data Quality
The dataset was clean with no missing values, but contained over 3,000 duplicate entries that were systematically removed. The duplicates appeared to follow a pattern, suggesting they were not genuine unique observations.
Methodology
This project followed a comprehensive data science workflow using pandas and numpy for data manipulation, matplotlib and seaborn for visualization, and scikit-learn for machine learning models.
Data Preparation & Cleaning
- Data Inspection: Analyzed 14,999 employee records across 10 features
- Column Standardization: Renamed columns to snake_case format and corrected misspellings (e.g., 'average_montly_hours' to 'average_monthly_hours')
- Data Type Conversion: Converted categorical variables (work_accident, left, promotion_last_5_years) to appropriate data types
- Duplicate Removal: Identified and removed over 3,000 systematic duplicate entries
- Missing Value Check: Confirmed no missing values in the dataset
- Outlier Detection: Used boxplots to identify and analyze outliers in key variables
Exploratory Data Analysis
Conducted comprehensive analysis to understand relationships between variables and identify patterns contributing to employee turnover:
- Satisfaction Analysis: Employees who left showed significantly lower satisfaction levels
- Workload Impact: Employees who left worked 10 more hours monthly on average than those who stayed
- Project Load: Analyzed the relationship between number of projects and turnover
- Tenure Patterns: Examined how time at company affects retention
- Performance Correlation: Investigated the relationship between evaluation scores and turnover
- Departmental Analysis: Compared turnover rates across different departments
- Correlation Matrix: Created heatmaps to visualize feature relationships
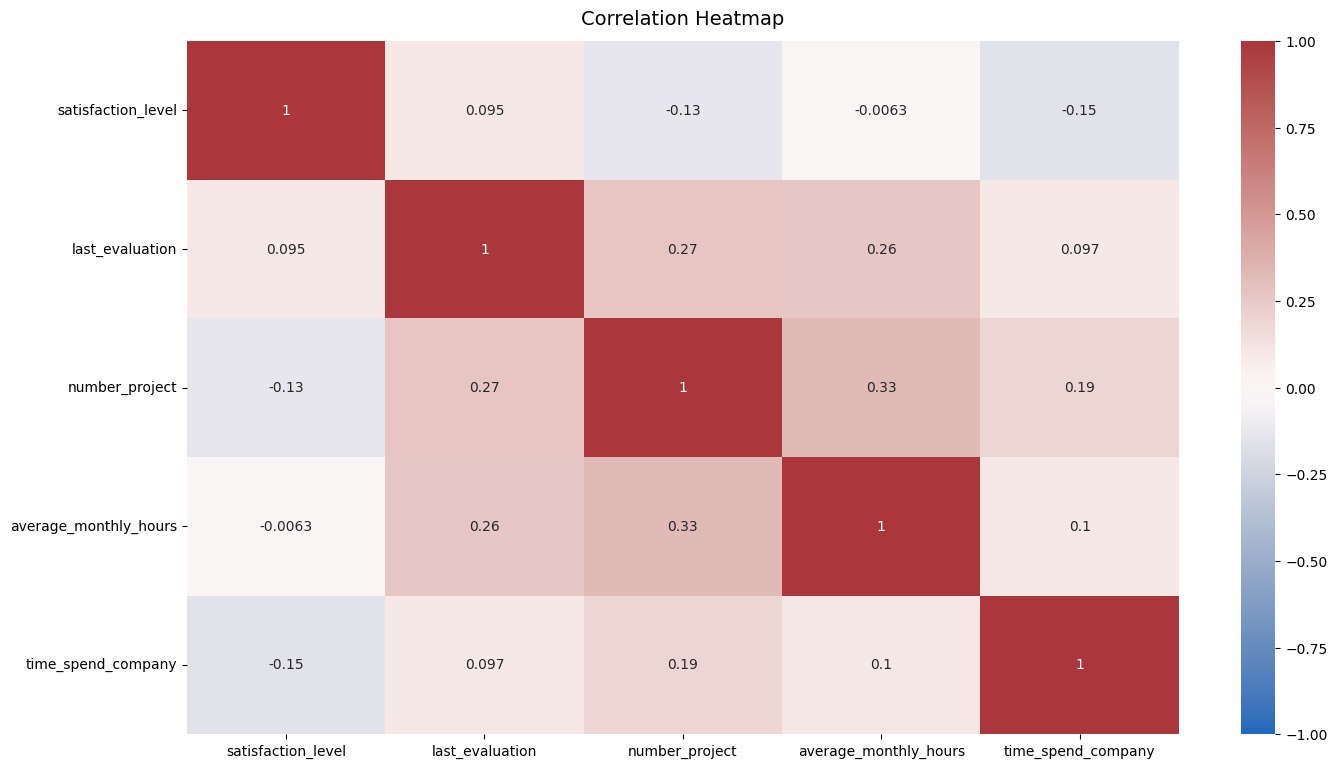
Figure 2: Correlation matrix of numerical features, highlighting relationships between workload (projects/hours) and performance evaluations.
Machine Learning Approach
Implemented and compared multiple algorithms to identify the best predictor of employee turnover:
- Logistic Regression: Baseline linear model with feature scaling
- Decision Tree: Non-linear model to capture complex feature interactions
- Random Forest: Ensemble method for improved accuracy and feature importance
- Gradient Boosting: Advanced ensemble technique for optimal performance
- Hyperparameter Tuning: Used GridSearchCV to optimize model parameters
- Feature Importance Analysis: Extracted key factors driving predictions
Model Evaluation Framework
Comprehensive evaluation using multiple metrics to ensure robust model assessment:
- Accuracy: Overall correctness of predictions
- Precision: Ability to correctly identify employees who will leave (minimize false positives)
- Recall: Ability to find all employees who will leave (minimize false negatives)
- F1-Score: Harmonic mean of precision and recall for balanced assessment
- ROC-AUC: Model's ability to distinguish between classes across all thresholds
- Cross-Validation: Ensured model generalizability and prevented overfitting
Key Findings & Results
Model Performance Comparison
The tree-based models significantly outperformed logistic regression, indicating complex, non-linear relationships between features and employee turnover:
- Logistic Regression: 83.0% accuracy, 80.0% precision, 83.0% recall, 80.0% F1-score
- Decision Tree: 96.2% accuracy, 87.0% precision, 90.4% recall, 88.7% F1-score, 93.8% ROC-AUC
- Random Forest: 97.1% accuracy, 95.7% precision, 88.4% recall, 91.9% F1-score, 98.7% ROC-AUC
- Gradient Boosting: 97.4% accuracy, 95.7% precision, 88.4% recall, 91.9% F1-score, 98.7% ROC-AUC
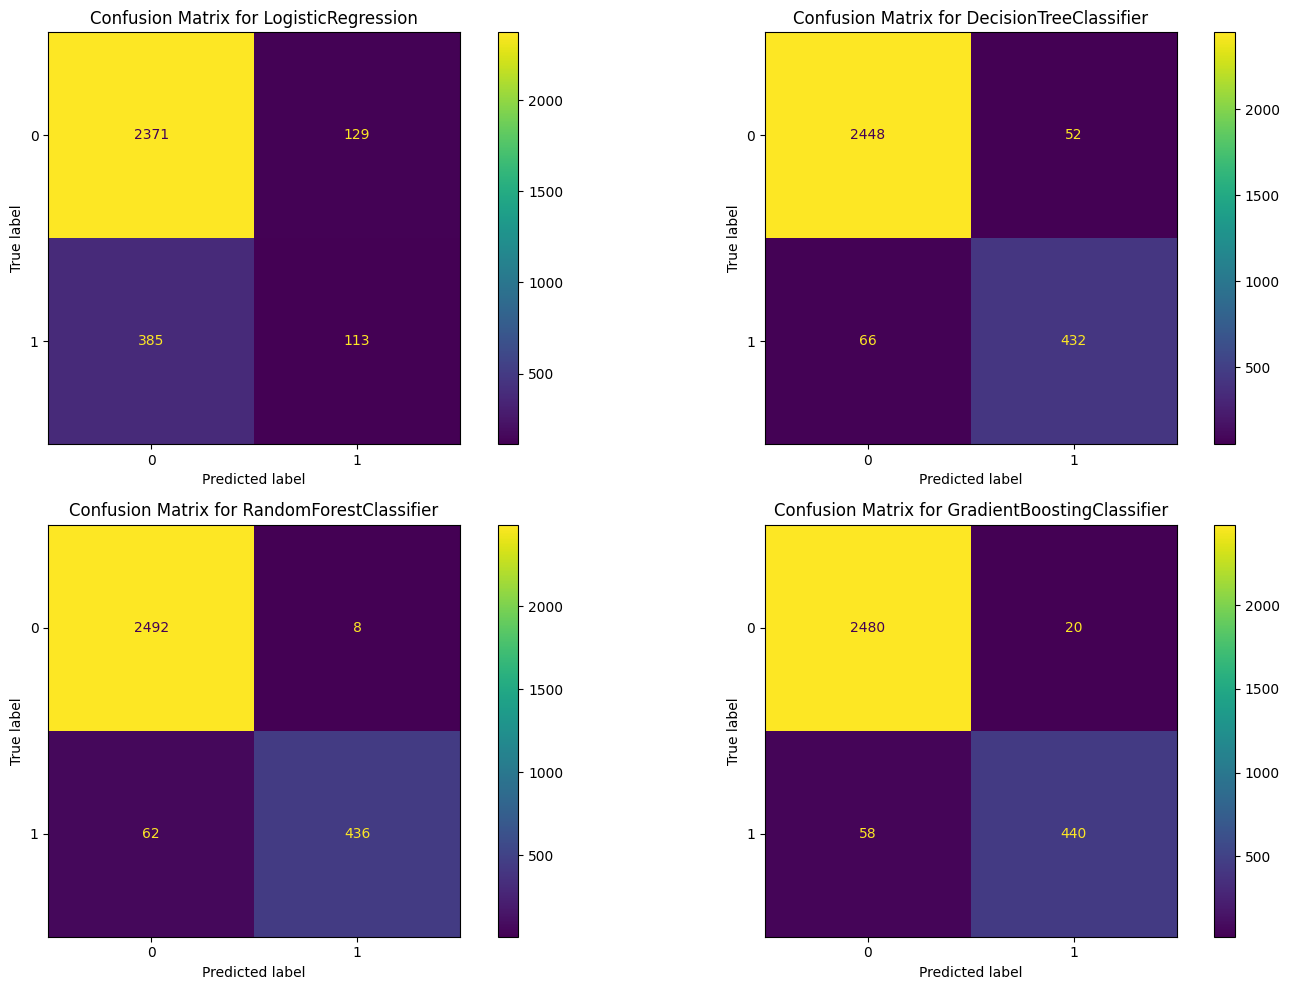
Figure 3: Confusion matrices for tested models. Tree-based ensemble methods (Random Forest and Gradient Boosting) show superior ability to correctly classify both departures and retentions.
Best Performing Model
After hyperparameter tuning, the Random Forest model achieved optimal performance with the following configuration:
- Best Parameters: max_depth=13, n_estimators=100
- Cross-Validation Score: 94.5%
- Final Test Accuracy: 97.1%
Critical Discovery: Workload Impact
The most significant finding from the exploratory analysis:
- Hours Worked: Employees who left worked 10 more hours monthly on average than those who stayed
- Satisfaction Gap: Departing employees showed significantly lower satisfaction levels
- Workload Correlation: This excess in hours is likely one of the main factors driving employees' decisions to leave
Feature Importance Analysis
The models identified the most critical factors contributing to employee turnover:
- Number of Projects: Heavy project loads emerged as a top predictor
- Average Monthly Hours: Excessive working hours strongly correlated with turnover
- Satisfaction Level: Low satisfaction was a primary indicator of departure risk
- Last Evaluation Score: Performance ratings showed complex relationships with retention
- Time at Company: Tenure patterns revealed critical retention points
Key Insights from Data Analysis
The comprehensive analysis revealed several important patterns:
- Overwork Pattern: Employees handling excessive projects and working 250+ monthly hours showed highest turnover risk
- Four-Year Threshold: Employees with approximately 4 years at the company demonstrated particular dissatisfaction patterns
- Promotion Gap: High-performing employees without recent promotions were more likely to seek opportunities elsewhere
- Non-Linear Relationships: The tree-based models' superior performance indicates complex, non-linear relationships between features and turnover decisions
Strategic Recommendations
Based on the feature importance analysis and model insights, the following evidence-based recommendations were developed to address the primary drivers of employee turnover at Salifort Motors:
Immediate Workload Management Actions
- Project Load Caps: Implement a maximum limit on the number of projects employees can work on simultaneously to prevent overwork
- Monthly Hours Monitoring: Establish systems to track and manage monthly working hours, with alerts when employees exceed healthy thresholds
- Workload Redistribution: Ensure projects are distributed equitably across teams to prevent individual burnout
- Resource Allocation: Hire additional staff or redistribute work when project demands consistently exceed capacity
Career Development & Retention Strategy
- Four-Year Milestone Program: Consider promoting employees who have been with the company for at least four years, or conduct targeted investigation into why four-year tenured employees show high dissatisfaction
- Proactive Career Conversations: Implement regular career development discussions, especially for employees approaching critical tenure milestones
- Promotion Pipeline: Create clear pathways for advancement to address the promotion gap identified in the analysis
- Skill Development Programs: Provide opportunities for employees to develop new competencies and take on varied project types
Compensation & Recognition Reform
- Overtime Policy Clarification: Either reward employees appropriately for working longer hours, or establish clear expectations that excessive hours are not required
- Policy Transparency: If employees aren't familiar with the company's overtime pay policies, provide clear communication about compensation structures
- Performance Evaluation Overhaul: High evaluation scores should not be reserved for employees who work 200+ hours per month - consider a proportionate scale for rewarding employees based on contribution and effort, not just hours
- Recognition Programs: Implement systems to acknowledge and reward high performers who maintain work-life balance
Cultural & Communication Initiatives
- Company-Wide Culture Assessment: Hold comprehensive discussions to understand and address work culture issues across the organization and within specific teams
- Expectation Clarity: If expectations around workload and time off aren't explicit, make them clear through formal policies and communication
- Regular Pulse Surveys: Implement frequent satisfaction surveys to monitor employee sentiment and identify issues before they lead to turnover
- Work-Life Balance Advocacy: Promote a culture that actively values and protects employee well-being
Next Steps & Future Research
To build on this analysis and continue improving retention strategies:
- Data Leakage Investigation: Consider how predictions change when 'last_evaluation' is removed from the model, as evaluations may not be performed frequently enough to be useful for real-time prediction
- Alternative Prediction Targets: Explore predicting performance scores or satisfaction levels as leading indicators of turnover risk
- Model Deployment: Implement the trained model in a production environment to identify at-risk employees proactively
- Longitudinal Analysis: Track the effectiveness of implemented recommendations through ongoing data collection and analysis
- Segmentation Analysis: Conduct cluster analysis to identify distinct employee groups with different retention needs and tailor strategies accordingly
Jupyter Notebook
The complete analysis, including code, visualizations, and detailed findings, is available in the embedded Jupyter notebook below.
Loading notebook... This may take a moment.